
We’ve toured the Application Builder and know our way around Page Designer’s three-pane layout. Now it’s time to actually understand what you’re placing inside it, how APEX identifies and passes data between pages behind the scenes, and how to see what’s really happening when something doesn’t work as expected. These three topics are naturally connected — components live on pages, pages are identified by URLs, and debugging is how you see the relationship between the two.
"A page in APEX is really just a collection of components, rendered based on what the URL and session state tell it to show."
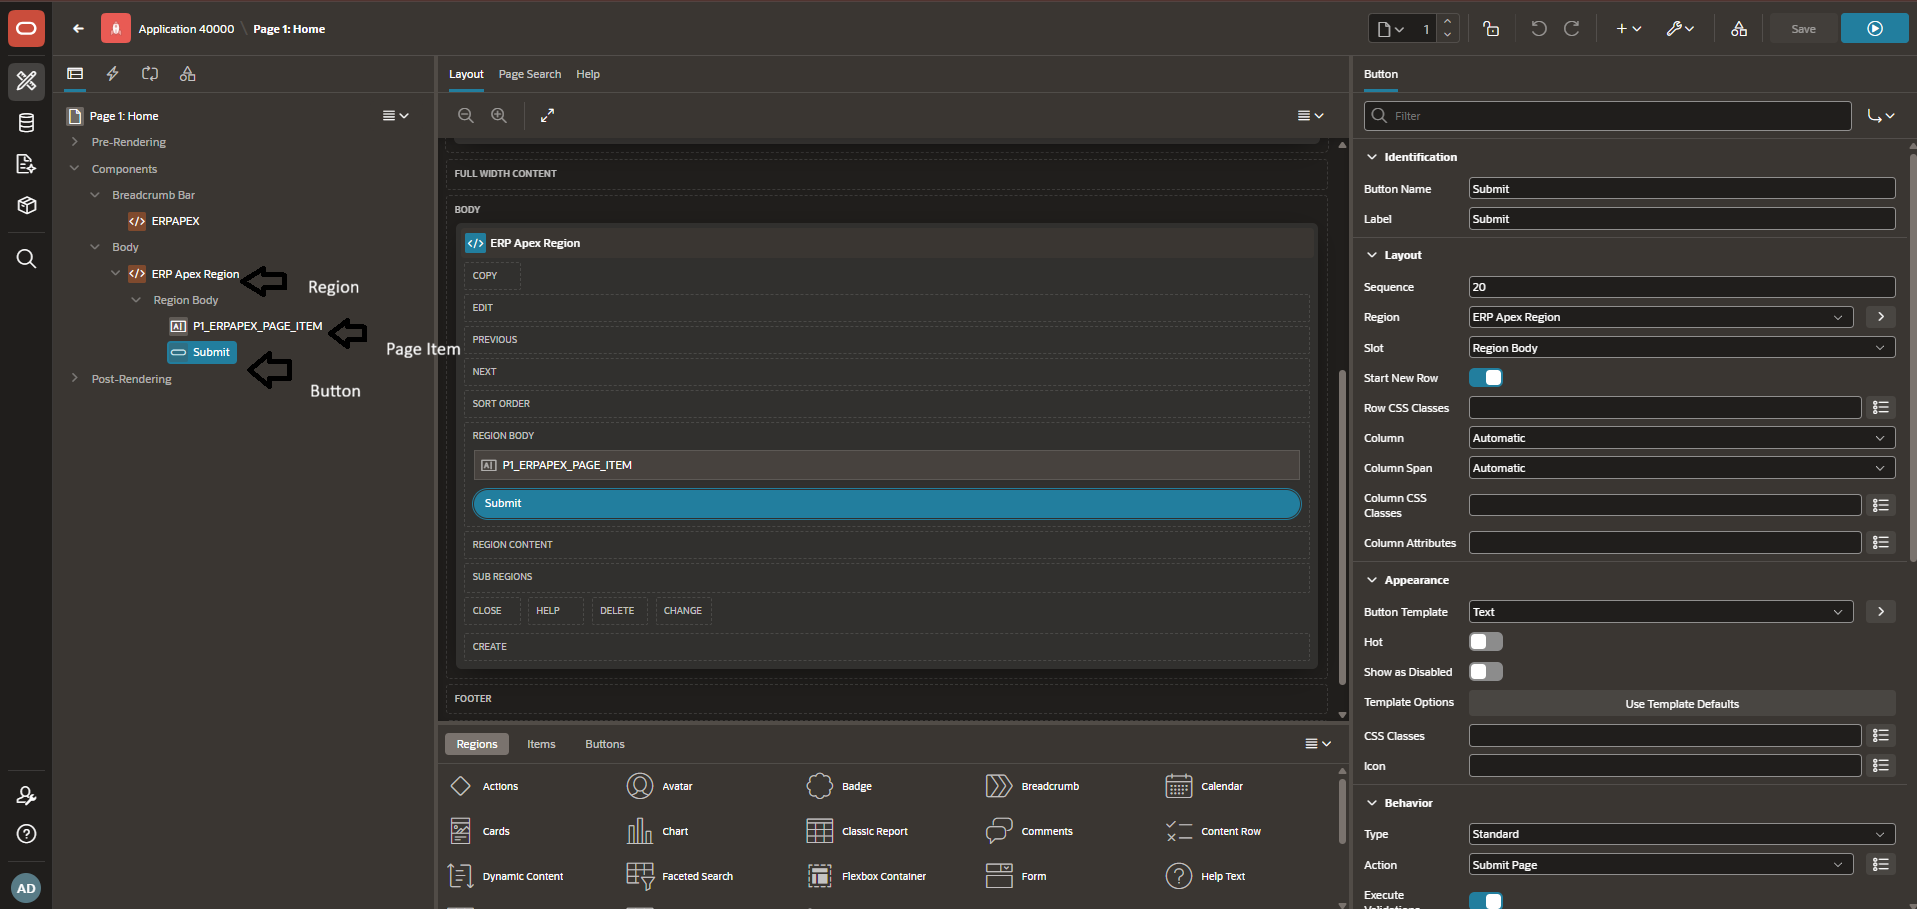
Let’s start with components, since everything else in this post builds on understanding them.
Part 1: Page Designer Components
Every page in APEX is built from a small set of core component types, all visible in Page Designer’s left-hand Rendering tree.
Regions are containers — the structural boxes that organize everything else on a page. A region might be a report, a form, a static HTML block, or a chart. Every other component (items, buttons) lives inside a region.
Items are the actual input/output fields — text fields, select lists, checkboxes, display-only text. Items can live on a page (visible only while that page is open) or at the application level (available everywhere, useful for things like a logged-in username shown across every page).
Buttons trigger actions — submitting the page, navigating elsewhere, or firing a Dynamic Action. Each button has a defined action type and, often, a associated process or branch that runs when it’s clicked.
Dynamic Actions are APEX’s client-side interactivity layer — show/hide logic, AJAX calls, JavaScript execution, all without writing raw JavaScript for simple cases. We’ll cover these in real depth in Week 2, but it’s worth knowing now that they exist and where they show up in Page Designer’s Processing tree.
Quick Example: Building a Simple Region and Item
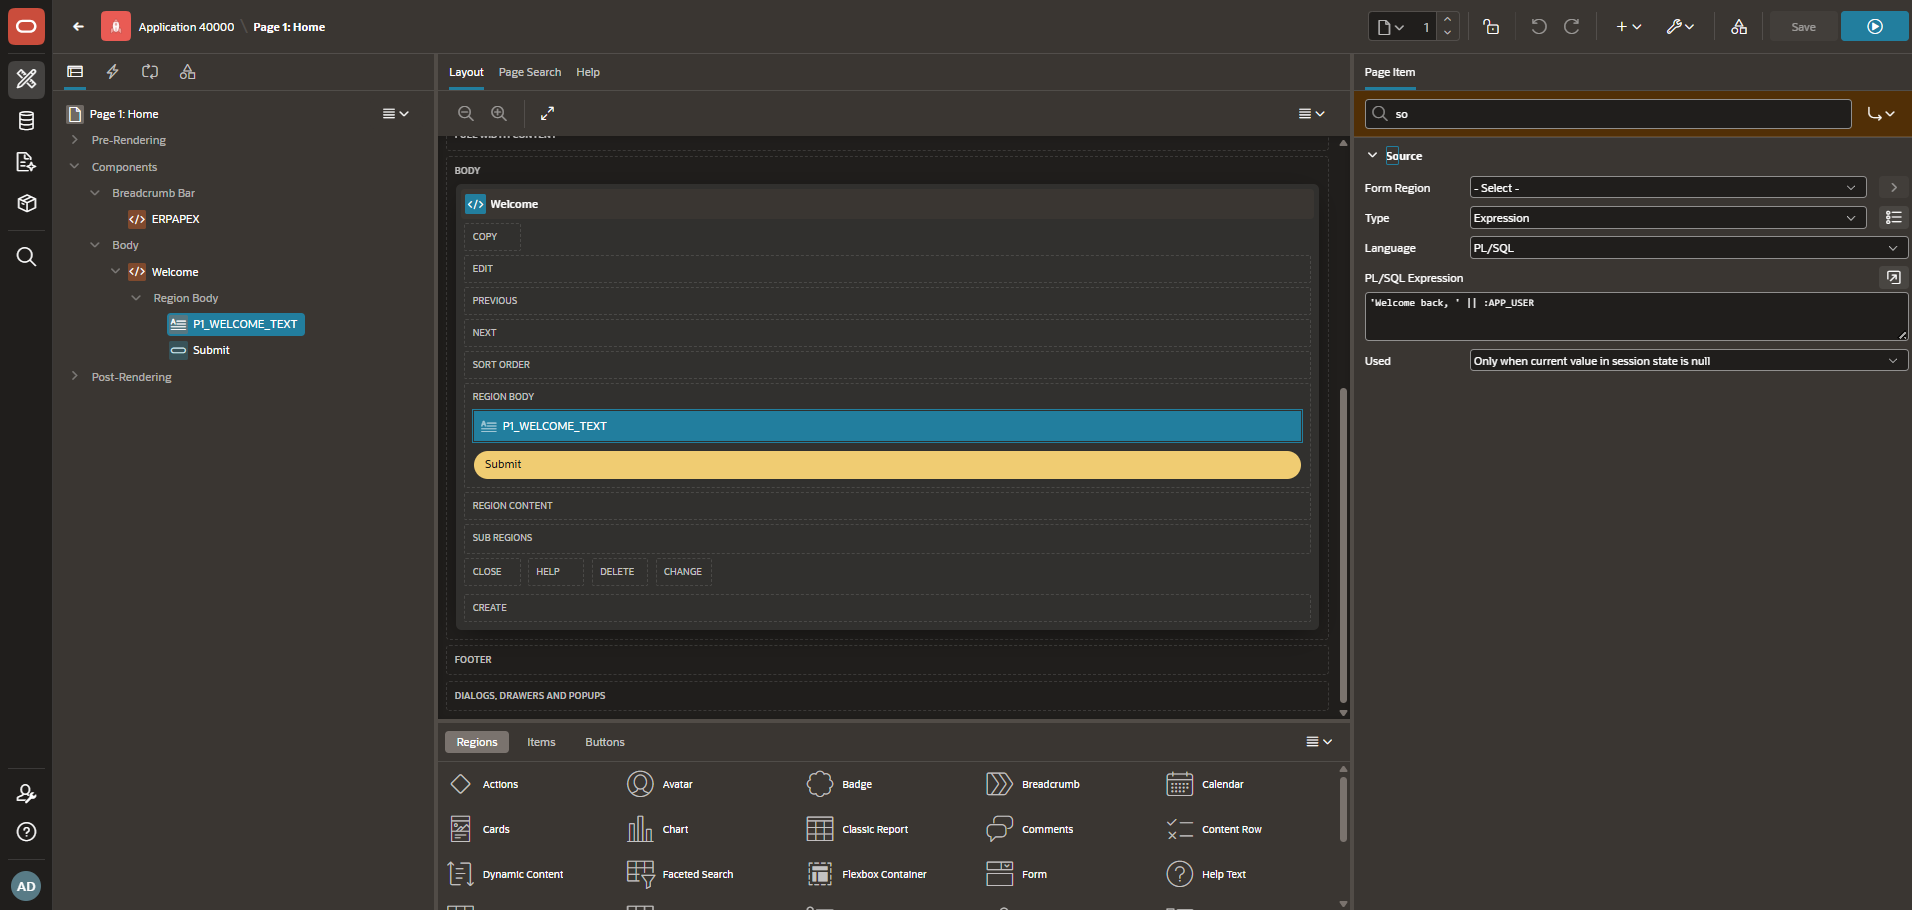
Here’s a minimal example to make this concrete. Say you want a page that displays a welcome message with the logged-in user’s name:
- In Page Designer, right-click the Regions node in the Rendering tree → Create Region
- Set Type to “Static Content,” give it a title like “Welcome”
- Right-click that new region → Create Page Item
- Set the item’s Type to “Display Only,” name it
P1_WELCOME_TEXT - In the item’s Source property, set it to
'Welcome back, ' || :APP_USER
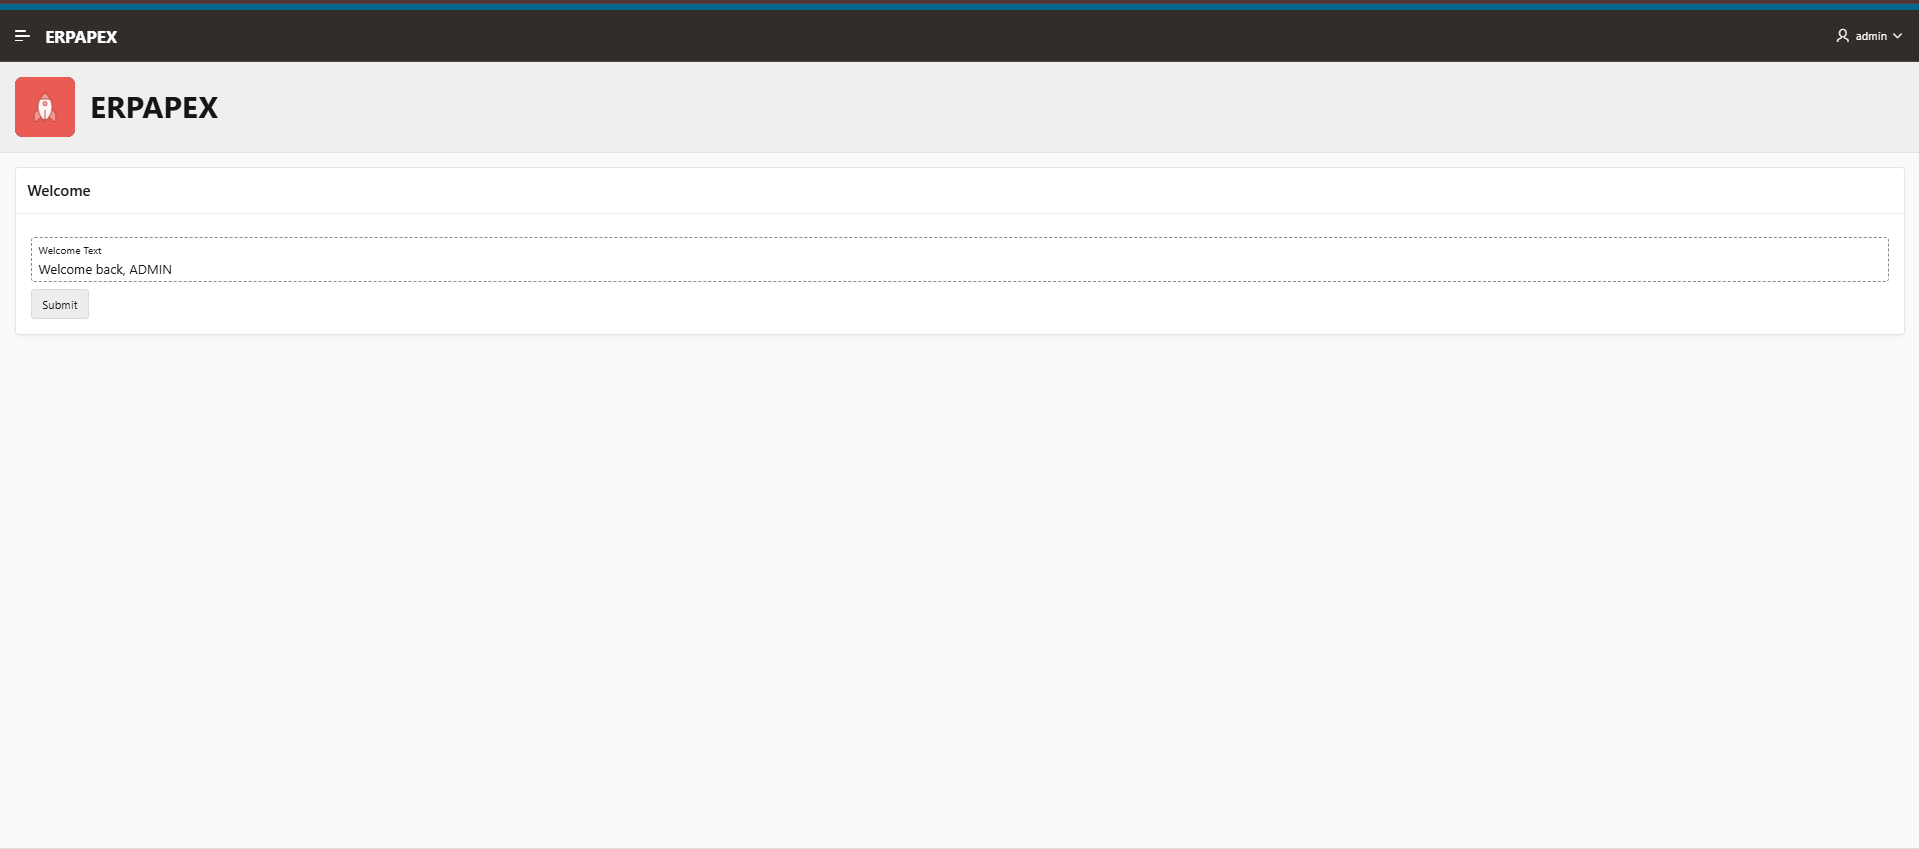
Run the page, and you’ll see a static region containing a dynamically generated welcome message — a small example, but it demonstrates the region-contains-item relationship that every more complex page builds on.
Part 2: URL Structure & Parameters
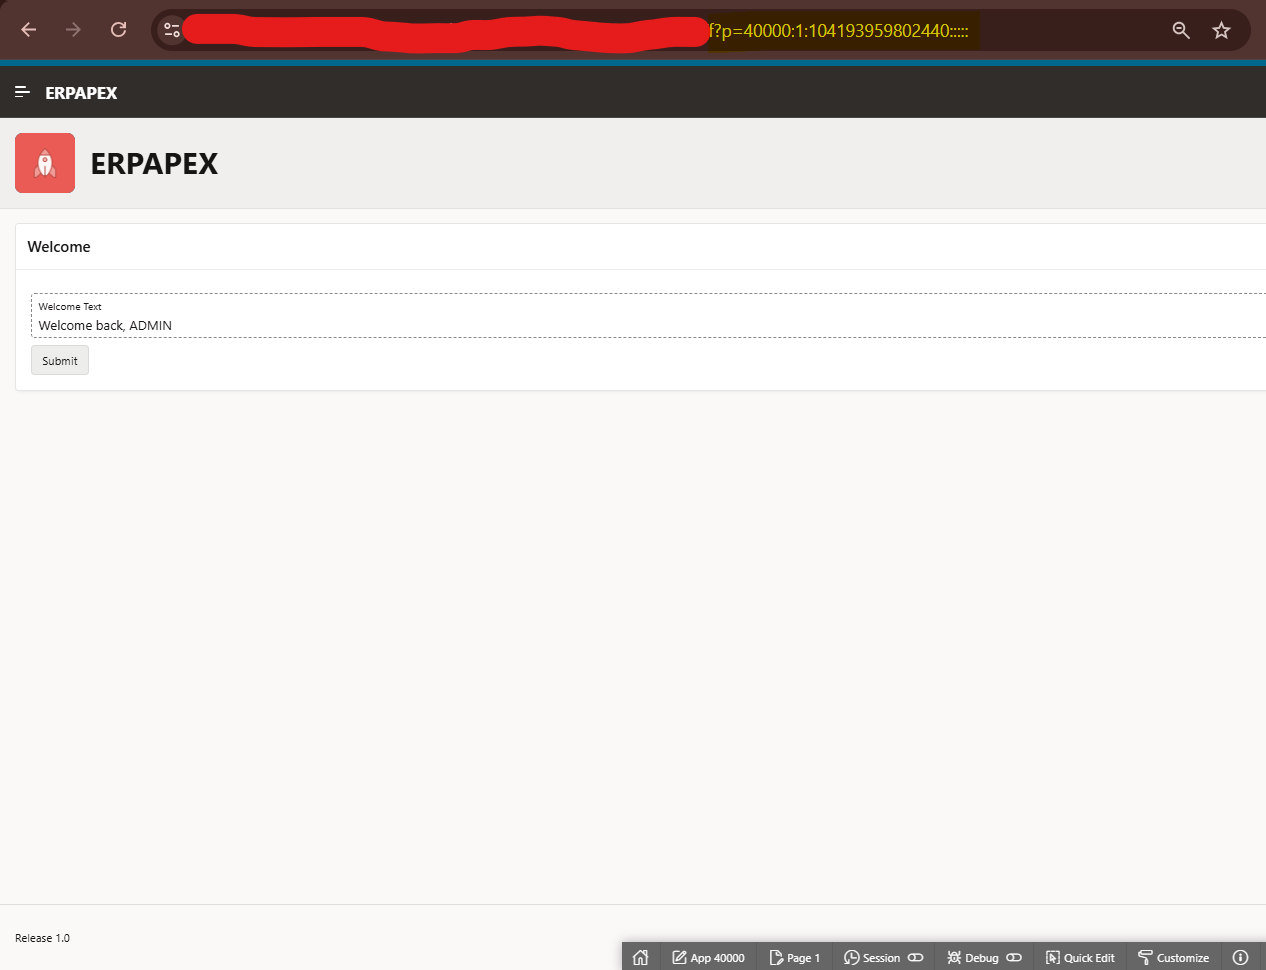
APEX URLs look intimidating at first, but they follow a consistent, learnable pattern. A typical APEX URL looks like this:
https://your-domain.com/apex/f?p=40000:5:12345::NO::P5_ID:42
Breaking this down by position:
| Segment | Meaning |
|---|---|
f?p= | Standard APEX URL prefix |
40000 | Application ID (ERPApex’s application ID) |
5 | Page number |
12345 | Session ID |
| (blank) | Request (often blank, sometimes a button name) |
NO | Debug flag (YES/NO) |
P5_ID | Item name to set |
42 | Value to set that item to |
That last pair — P5_ID:42 — is how APEX passes a value into a page via the URL itself, without requiring a form submission. This is genuinely useful: a report link that says “View Order #42” can pass that order ID directly into the target page’s item through the URL, and that page can immediately query based on it.
Example: If Page 5 has an item called P5_ORDER_ID, and its Source is set to query based on that item’s value, then linking to:
f?p=40000:5:&SESSION.::NO::P5_ORDER_ID:42…opens Page 5 already loaded with Order #42’s details, no extra clicks required.
Part 3: Sessions and Debugging
Every APEX interaction happens inside a session — a server-side record of who’s logged in, what page they’re on, and the current value of every item across the application. This is different from how many web frameworks handle state; APEX keeps it server-side and ties it to that session ID you saw in the URL structure above.
When something isn’t behaving as expected — a page not showing the data you expect, a process not firing — APEX’s built-in debugging tools are the fastest path to an answer.
Step-by-Step: Debugging a Page
- Enable Debug Mode — Run the page, then in the Developer Toolbar at the bottom of the screen, click Debug. This reloads the page with debug logging active.
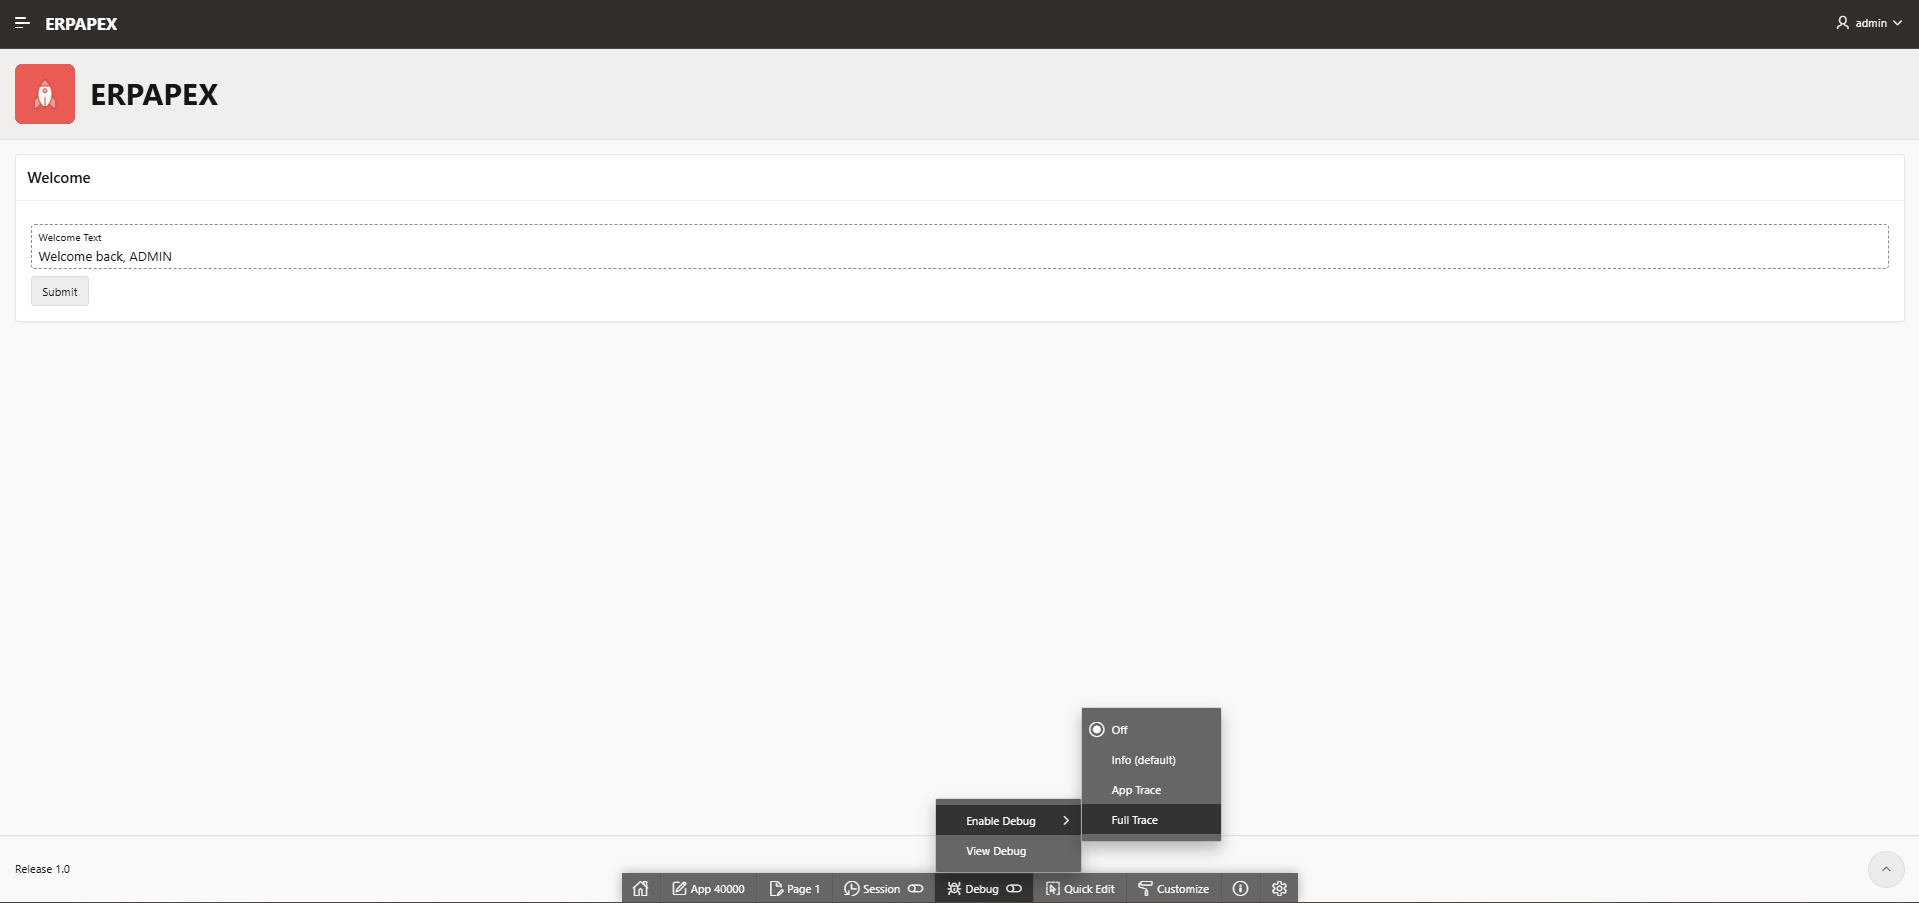
2. Open the Debug view — From the Developer Toolbar, select View Debug. This shows a detailed, timestamped log of every process, validation, and computation that ran during page load.
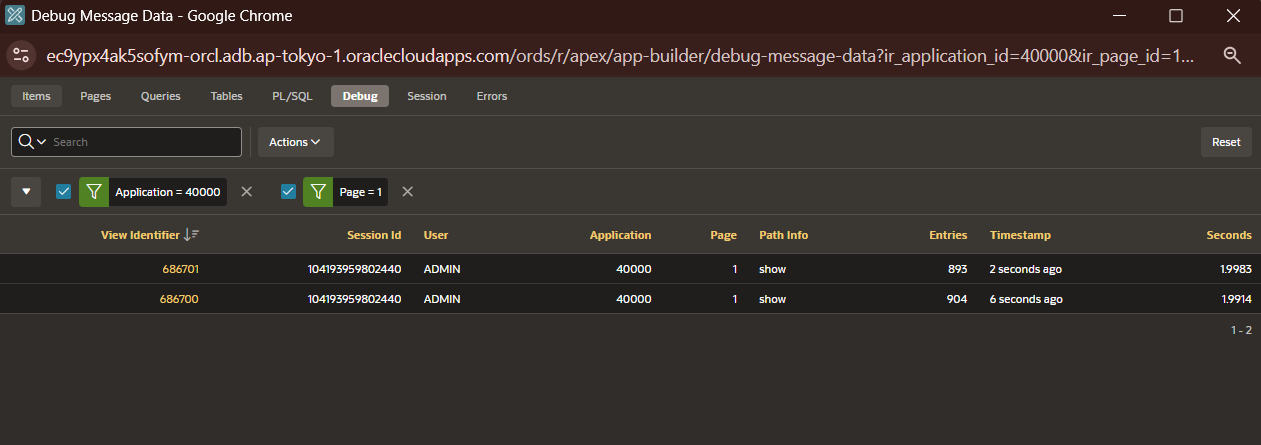
3. Look for your component by name — Search the log for the specific item, region, or process you’re troubleshooting. Each entry shows whether conditions were met, what SQL ran, and what values were returned.
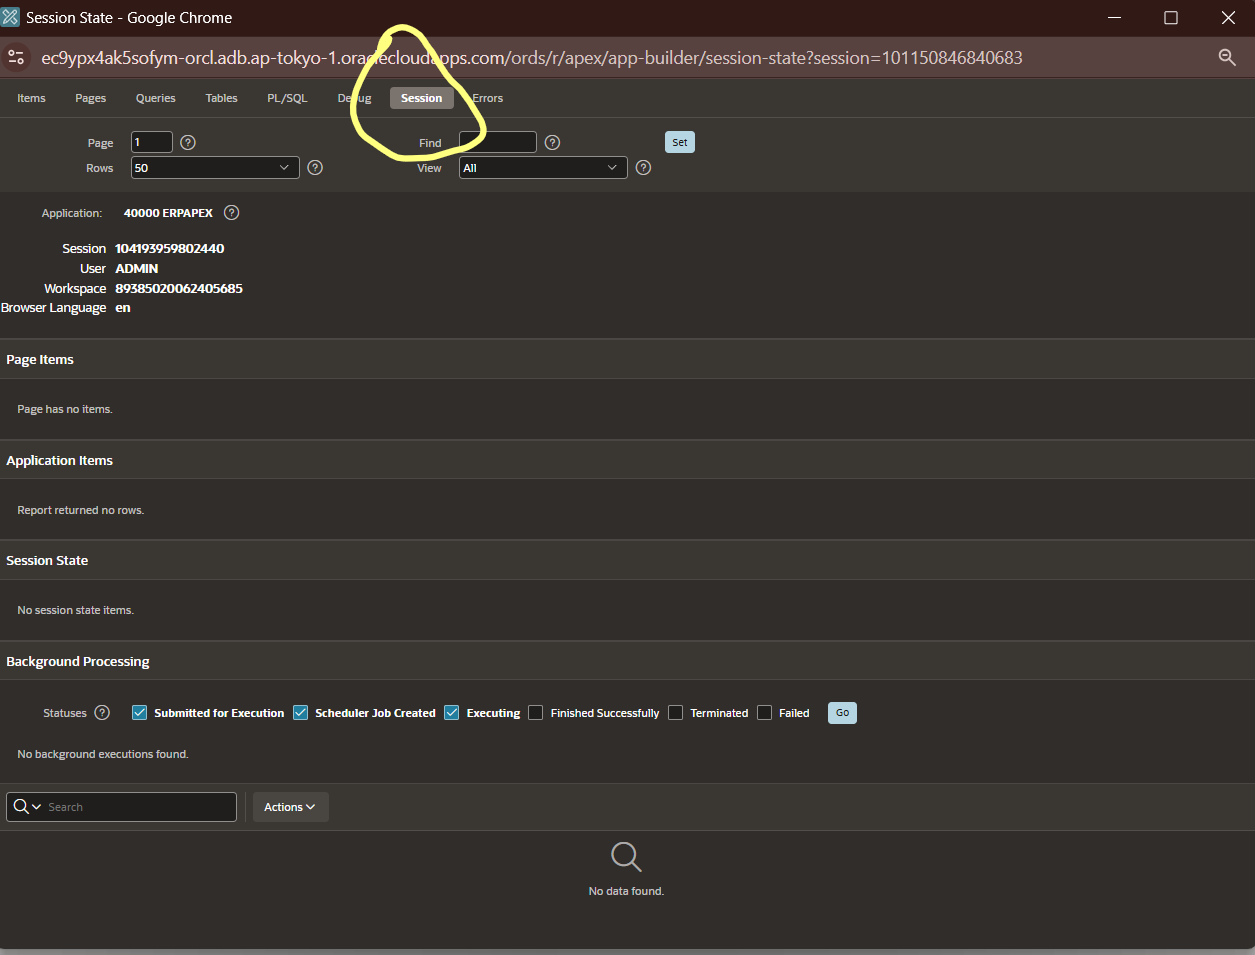
4. Check Session State directly — From the Developer Toolbar, click Session to see the live value of every item in the current session. This is often the fastest way to confirm whether an item actually contains the value you expect it to.
Practical tip: Debug Mode has a performance cost, so it’s automatically excluded from being cached and shouldn’t be left on in a production environment for regular users — but as a development habit, checking the debug log before guessing at a fix will save you far more time than trial-and-error changes.
What’s Next
With components, URLs, and debugging now in your toolkit, we’re ready to look at how an application’s overall configuration works. Next in the series: Application Properties & Settings, APEX Development Environment, and Basic SQL & PL/SQL for APEX — the last few foundational pieces before you build your very first complete application.